Before we get going, this series is free because I don’t think a comprehensive guide like this exists and I want to keep it accessible. But I can only do things this way because people who can pay, do. If you’ve been thinking about financially supporting the newsletter but haven’t taken the plunge - NOW IS THE TIME.
If you can’t pay right now, please forward this to as many people as you can. Word of mouth is the best way to grow readership. However you are supporting, thank you for being here!
Welcome to part 2 of Growing Concerns – a new series where we’re taking a take a deep-dive into everything concerning growth, appetite, and changing bodies. In part 1 we focussed on growth in babies, toddlers and little kids. In today’s instalment, we’re going to look more closely at bigger kids: preteens and teens. Next week we’ll look at how we can support changing and developing bodies, protecting embodiment, and preventing eating disorders.
As we discussed in part 1, children between the ages of 0-4 are plotted on UK-WHO growth charts. Over 4 years of age, they’ll be moved to UK-WHO growth charts for 2-18 years. The main difference with these charts is that they don’t monitor head circumference. Instead they include guidance on the onset and progression of puberty, a BMI centile lookup, an adult height predictor and a mid parental height comparator. These charts are based on a combination of the samples we discussed in part 1 and the UK 1990 reference charts. You’d be forgiven for thinking these were taken from a reference population in 1990, but they were derived from a series of 17 surveys spanning 1978-1994. These were considered to be a nationally representative sample at the time. But the UK population looks very different now than it did in 1978, which is worth holding in mind when interpreting your kid's growth.
One area that growth curves get used a lot is in eating disorder recovery; looking at historical growth can help clinicians better understand what a healthy weight is for an adolescent who has been very malnourished, for example.
The National Child Measurement Programme and BMI Centiles
Most of you will, by now, be sick of hearing me talking about the NCMP, so I will keep it brief and you can go back and read some of my more focussed posts if you want more context. I will mention that the NCMP is not a comprehensive health check, in the same way that health visitor appointments are for younger children. It is predominantly a data collection exercise.
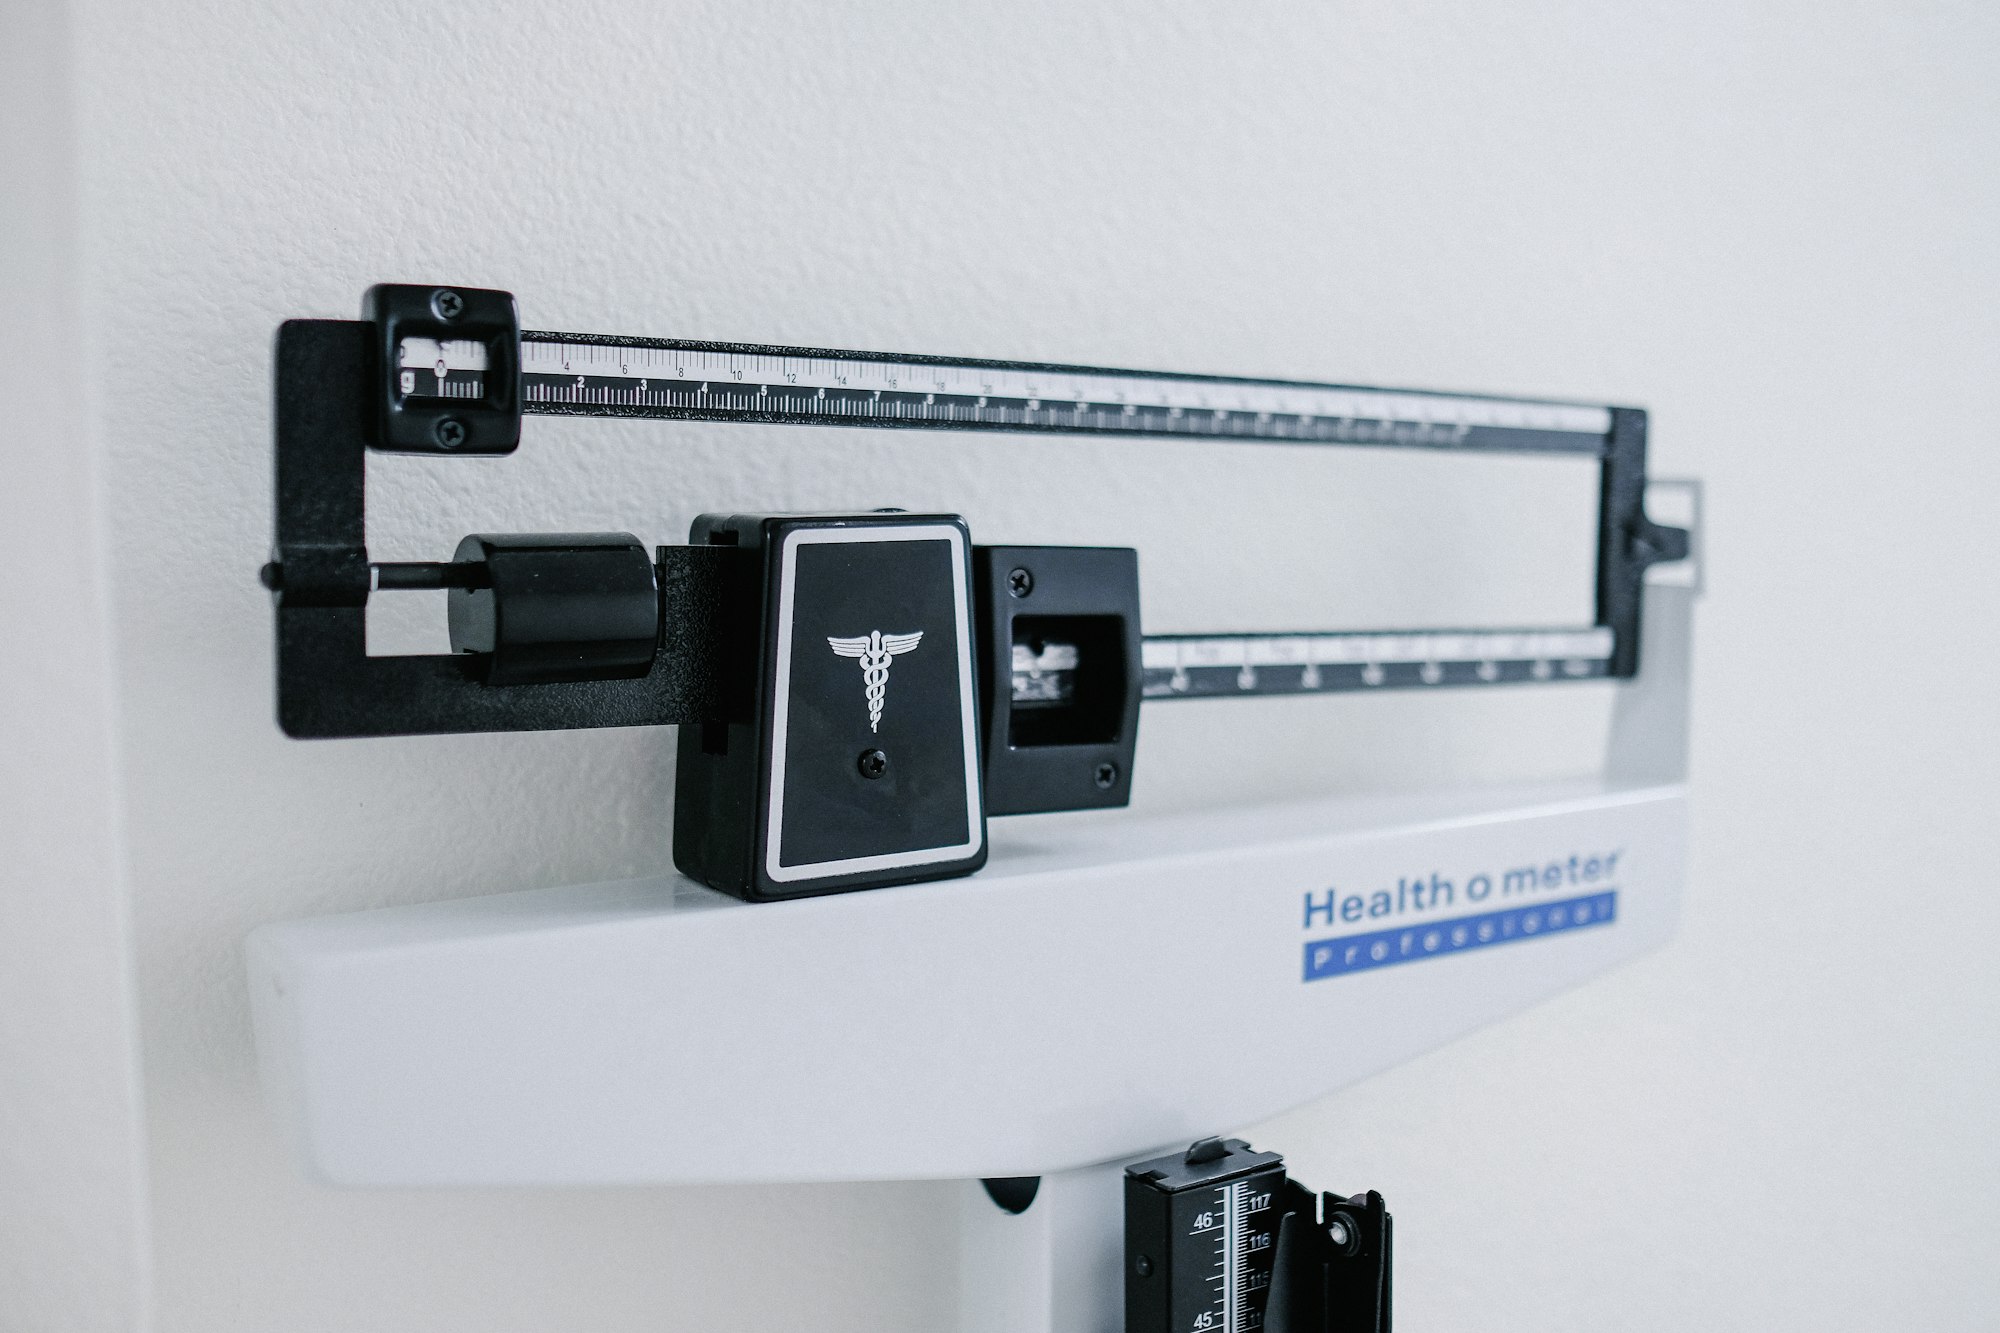
In Reception (when children are aged 4-5), and again in Year 6 (age 10-11) children will be weighed and have their height measured. This is usually done by school nurses or health care assistants (HCA).
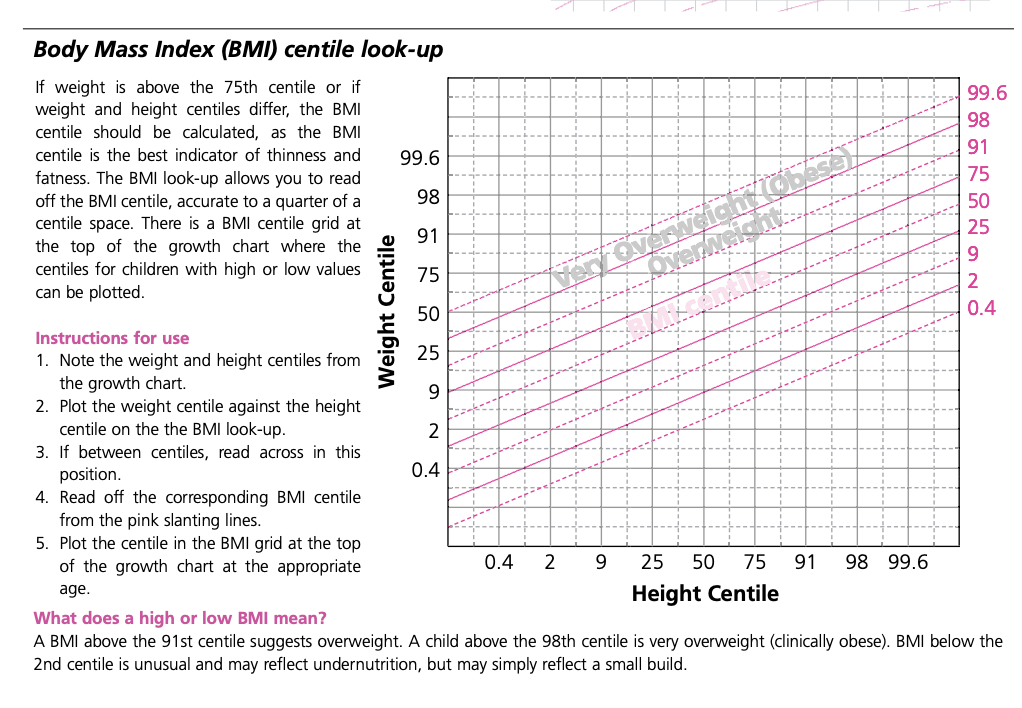
Height and weight are then plotted on the UK-WHO 2-18 growth curves against age (i.e. weight for age and height for age) to determine which centile they are on for each. Once the nurse or HCA has their weight and height centile, they will plot these two numbers on a BMI centile chart and read along to the corresponding BMI centile line. For example, using the chart below, a child on the 50th centile for weight and height would also be on the 50th centile for BMI. A child on the 98th centile for weight and height would be on the 91st BMI centile, which would indicate that they are ‘overweight’. In the NCMP, this would trigger a letter that gets sent home to parents. They might be invited to attend a local weight management programme or directed to the NHS Better Health website to discover ‘easy ways to eat well and move more’. Again, this is without any context of the child’s overall picture of health and wellbeing, including their mental health, neurotype, family life, or home environment (do they even have a reliable place to store and cook food, for instance?).