Welcome to Growing Concerns – a new series where we’re going to take a deep-dive into everything concerning growth, appetite, and changing bodies. The series is inspired by a conversation I keep having with parents in my nutrition practice. It goes a little like this: ‘their body is changing, but they’re too young to be starting puberty, right?’.
Wrong.
Puberty begins a long time before a kid gets their first period!
Not only does this have implications for how their body changes, but also their appetite, and nutrition needs. Preteens are acutely aware of social pressure to be thin, which is reinforced in science, food tech, and PE lessons. It is no surprise then, that this period is a vulnerable time for eating disorders to develop. What are the signs we need to look out for, and how can we broach conversations with our kids, particularly when they are fat and learning that there’s something ‘wrong’ with their bodies?
But we’re getting ahead of ourselves.
Before they’re preteens getting ready to go through puberty, they’re Big Kids, and before that Little Kids, toddlers, and babies.
Before we get going - this series is free because I don’t think a comprehensive guide like this exists and I want to keep it accessible. But I can only do things this way because people who can pay, do. If you’ve been thinking about financially supporting the newsletter but haven’t taken the plunge - NOW IS THE TIME.
If you can’t pay right now, please forward this to as many people as you can. Word of mouth is the best way to grow readership. However you are supporting, thank you for being here!
Alright team, let’s do this.
Today’s post is mostly covering what to expect in babies and preschool aged children - ages 0-4, plus a little bit about slightly older children. Next week, in part 2, we’ll cover the stages of puberty, and changing appetite and nutrition needs. Part 3 will cover body image and how to talk to preteens and teens about their changing bodies, particularly if they are fat. And a note that I am writing in the UK, so some of the content around growth charts and timings of health assessments are UK-specific. That said, a lot of this information is relevant no matter where you are.
As always, I’m working from a weight-inclusive paradigm. Bodies come in a variety of shapes and sizes. That means we use the word ‘fat’ to describe bodies in the same way as we would use ‘thin’, ‘tall’, or ‘small’. It’s a descriptor, not a judgement. And, we’re also operating from the perspective that fat bodies are not broken and don’t need to become smaller to earn care and respect.
Growth is about a lot more than weight, but in those early days and weeks after birth, weight can become a major source of anxiety for new parents. I think it’s helpful to understand why health professionals are interested in weight, and also have an understanding of how growth charts are developed and interpreted.
For people who have spent a lifetime dieting, have measured their worth by the number on the scales, or who have been subject to public weigh-ins at slimming clubs, I see you. Weighing your baby can feel fraught, and certainly conversations (and the science!) around growth are suffused with anti-fatness.
But – and it might surprise you to learn – I am pro growth charts!
I am not pro using them to put kids on diets, but they form an important part of the medical record and when I’m working with families I always ask to see the growth charts for a child (plus for any siblings if available).
Growth charts can provide really valuable information, but they cannot and should not be interpreted in isolation. They only make sense within the context of the child they belong to, their family and medical histories. Even then, you cannot look at a single data point on a growth chart and infer anything really meaningful – more on this later. But hopefully I can convince you that – in the absence of body shaming comments from doctors – growth charts and weigh-ins are not something you should be afraid of. (Doing it in front of all their friends at school is another story altogether!).
Many of you will already know that at birth, or shortly thereafter, all children in the UK are given a Personal Child Health Record (PCHR), commonly referred to as ‘the red book’. It’s used to document various aspects of a child's health, including things like vaccinations, screenings tests for hearing and vision, and health visitor reviews. At the back of the red book there are a variety of different growth charts; this will be where your midwife, and then your health visitor, will record the baby's weight, length, and head circumference.
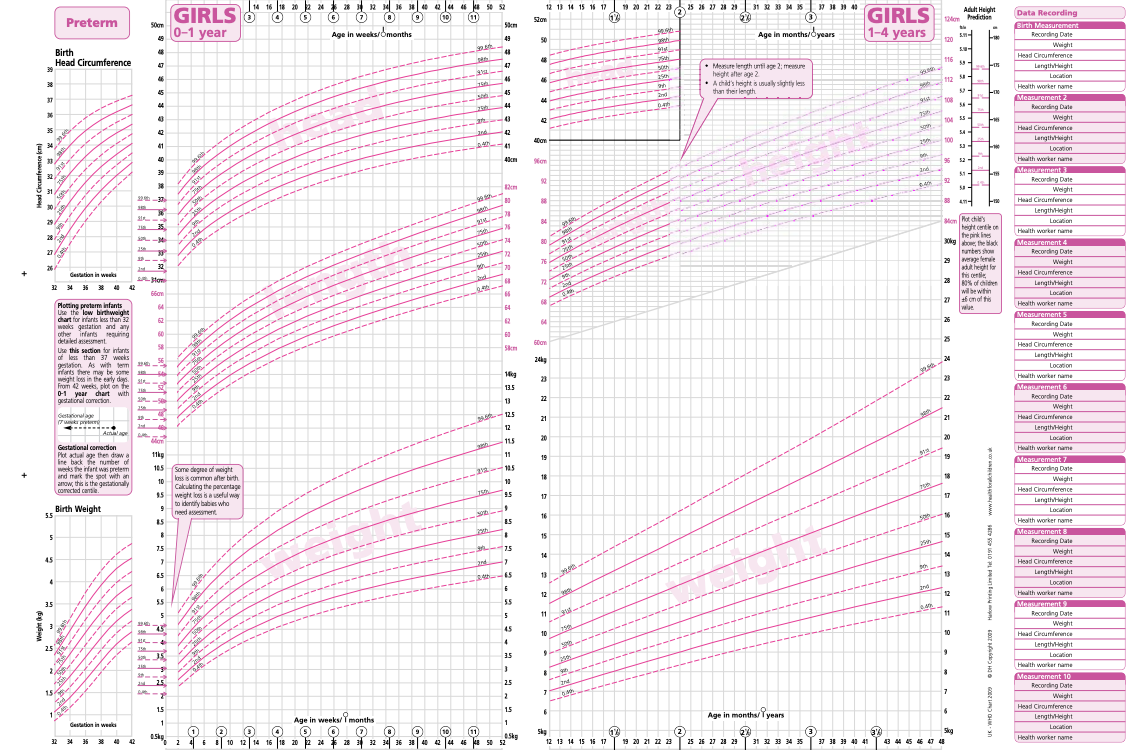
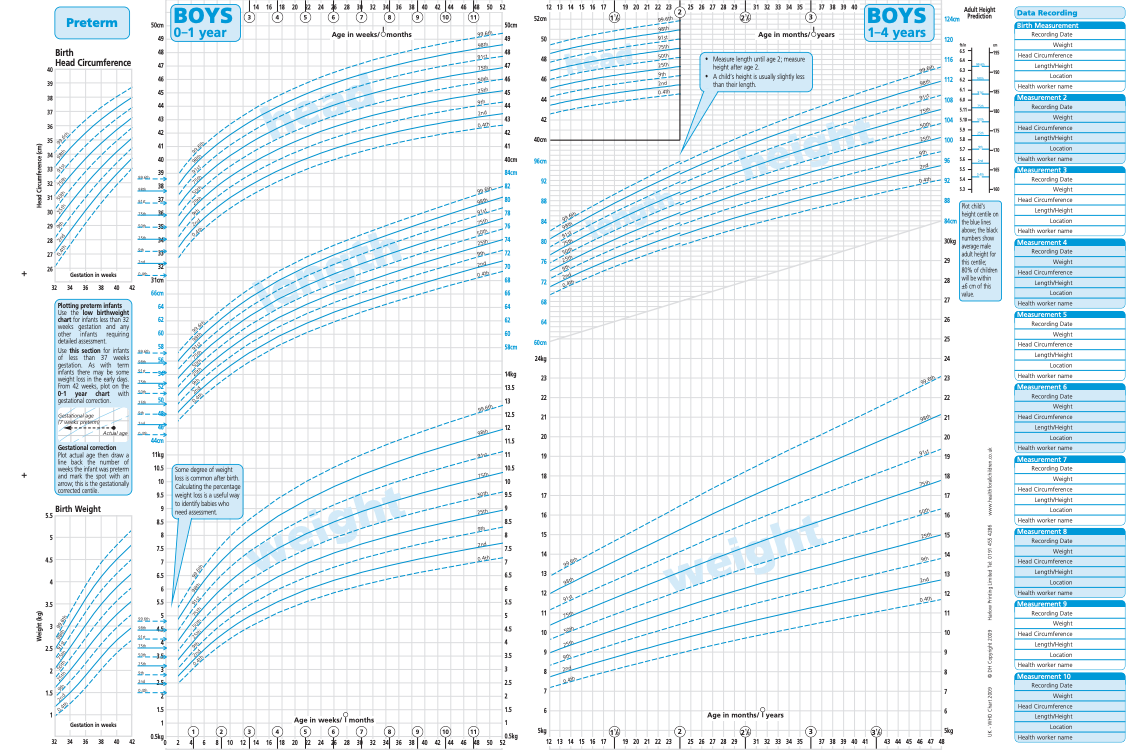
In the UK we use the UK-WHO growth charts for ages 0-4 years which were introduced in 2009 in England and 2010 in Scotland. They are also suitable for preterm infants born between 32-36 weeks gestation. They look like this:
These charts were developed based on weights of healthy, full-term, breastfed infants whose mothers did not smoke. Because of this, they are considered to represent patterns of ‘optimal’ growth. Clearly, there are some issues with this – namely comparing all babies against breastfed ones – but that’s a conversation for another time. The sample of babies used to develop the UK-WHO charts, despite the name, are not based on a representative sample of babies from the UK but were derived from babies from Brazil, Ghana, India, Oman, Norway and the US, between 1997 and 2003. These have become the standard against which babies in the UK are compared, regardless of how they are racialised, or whether they are fed human or formula milk. There are different charts for babies assigned male and female at birth (although they are labelled as ‘girls’ and ‘boys’ which will not represent all children). I think it’s helpful to have this background and context for understanding and interpreting your baby and child’s growth. The term ‘growth’ is often used as a proxy for weight, but as you can see from these charts they also include head circumference, length (below 2 years old), and height (over 2 years old).
As mentioned, the growth charts are developed based on measurements of a large sample of male and female babies and children at various ages. This provides reference ranges against which other babies (and later children) are compared. To do this, all the babies of the same sex and age are divided up into 100 bands known as centiles. This tells us the proportion of babies in that sample who fell at or below the weight/length/head circumference of a particular centile. In the UK, we are mostly concerned with weight, and when a bit older, length. When a baby’s weight is plotted on a growth curve, this tells us where their weight is relative to the babies who were measured in the sample used to develop the UK-WHO charts.
Parents often think that the 50th centile is a target to aim for or a ‘normal’ weight. This isn't a particularly helpful way to think about it since, assuming a baby is eating well, the centile they fall on will be largely out of our control. The 50th centile is simply the average weight of the babies in the reference sample. Half of the babies in the sample had a healthy weight that was higher and half had a healthy weight that was lower. The 5th centile means that out of 100 babies, 5 babies in the sample had a healthy weight at or below that weight. And the 95th centile means that for every 100 babies in the sample, 5 babies (or 5%) had a healthy weight higher than this. So whether your baby is in the 3rd or the 97th percentile, they are still at what is considered a 'healthy weight'.
Where a chart might indicate a problem is where a baby or child suddenly and inexplicably starts crossing centiles, in either direction. For instance, after a brief illness, it’s quite typical for a child’s weight to go down. Looking at that data point in isolation might cause us to worry, but if we measure them again a few months later, it’s quite likely they will be tracking nicely along their centile again. Likewise, and as we’ll see later, sometimes during puberty, children will gain weight quite quickly, making it look like they’ve jumped a centile line. Again, this might go back to their usual centile in another few months, which is why it’s important not to interfere based on a single data point (unless of course there is a clear medical indication that something is wrong). What we are more concerned about is when children jump several centiles without a clear explanation.
Sometimes, children will be on very low or very high centiles and there is a ‘mis-match’ between their weight and length and their birth parents' weight and height. If you have two parents who have a large stature, and a very small baby, that might indicate investigation is warranted (it doesn’t automatically mean you have to intervene – a watchful waiting approach might be more appropriate, especially if they are eating well and growing steadily, even on a lower centile). Generally, a baby’s stature is the average of both parents which will help give you a good idea of roughly which centile your baby might fall on.
If you pull out your baby’s red book (or look at the charts above), you might notice there are no centiles between 0-2 weeks old. This is because during this time, weight is highly variable. There is typically a small amount of weight loss immediately after birth due to fluid shifts. In those first two weeks, the midwife and then health visitor are keen to see the baby get back up to their birth weight. If babies lose 10% or more of their birth weight in those first few weeks, this generally means there is a problem with feeding, rather than an underlying health problem. This degree of weight loss usually only happens in babies who are breast or chest fed and is often to do with difficulty latching (you can of course get difficulty latching while the baby is still gaining weight – ask me how I know).
This post is free to read
Enter your email address to read this post and our library of free posts.